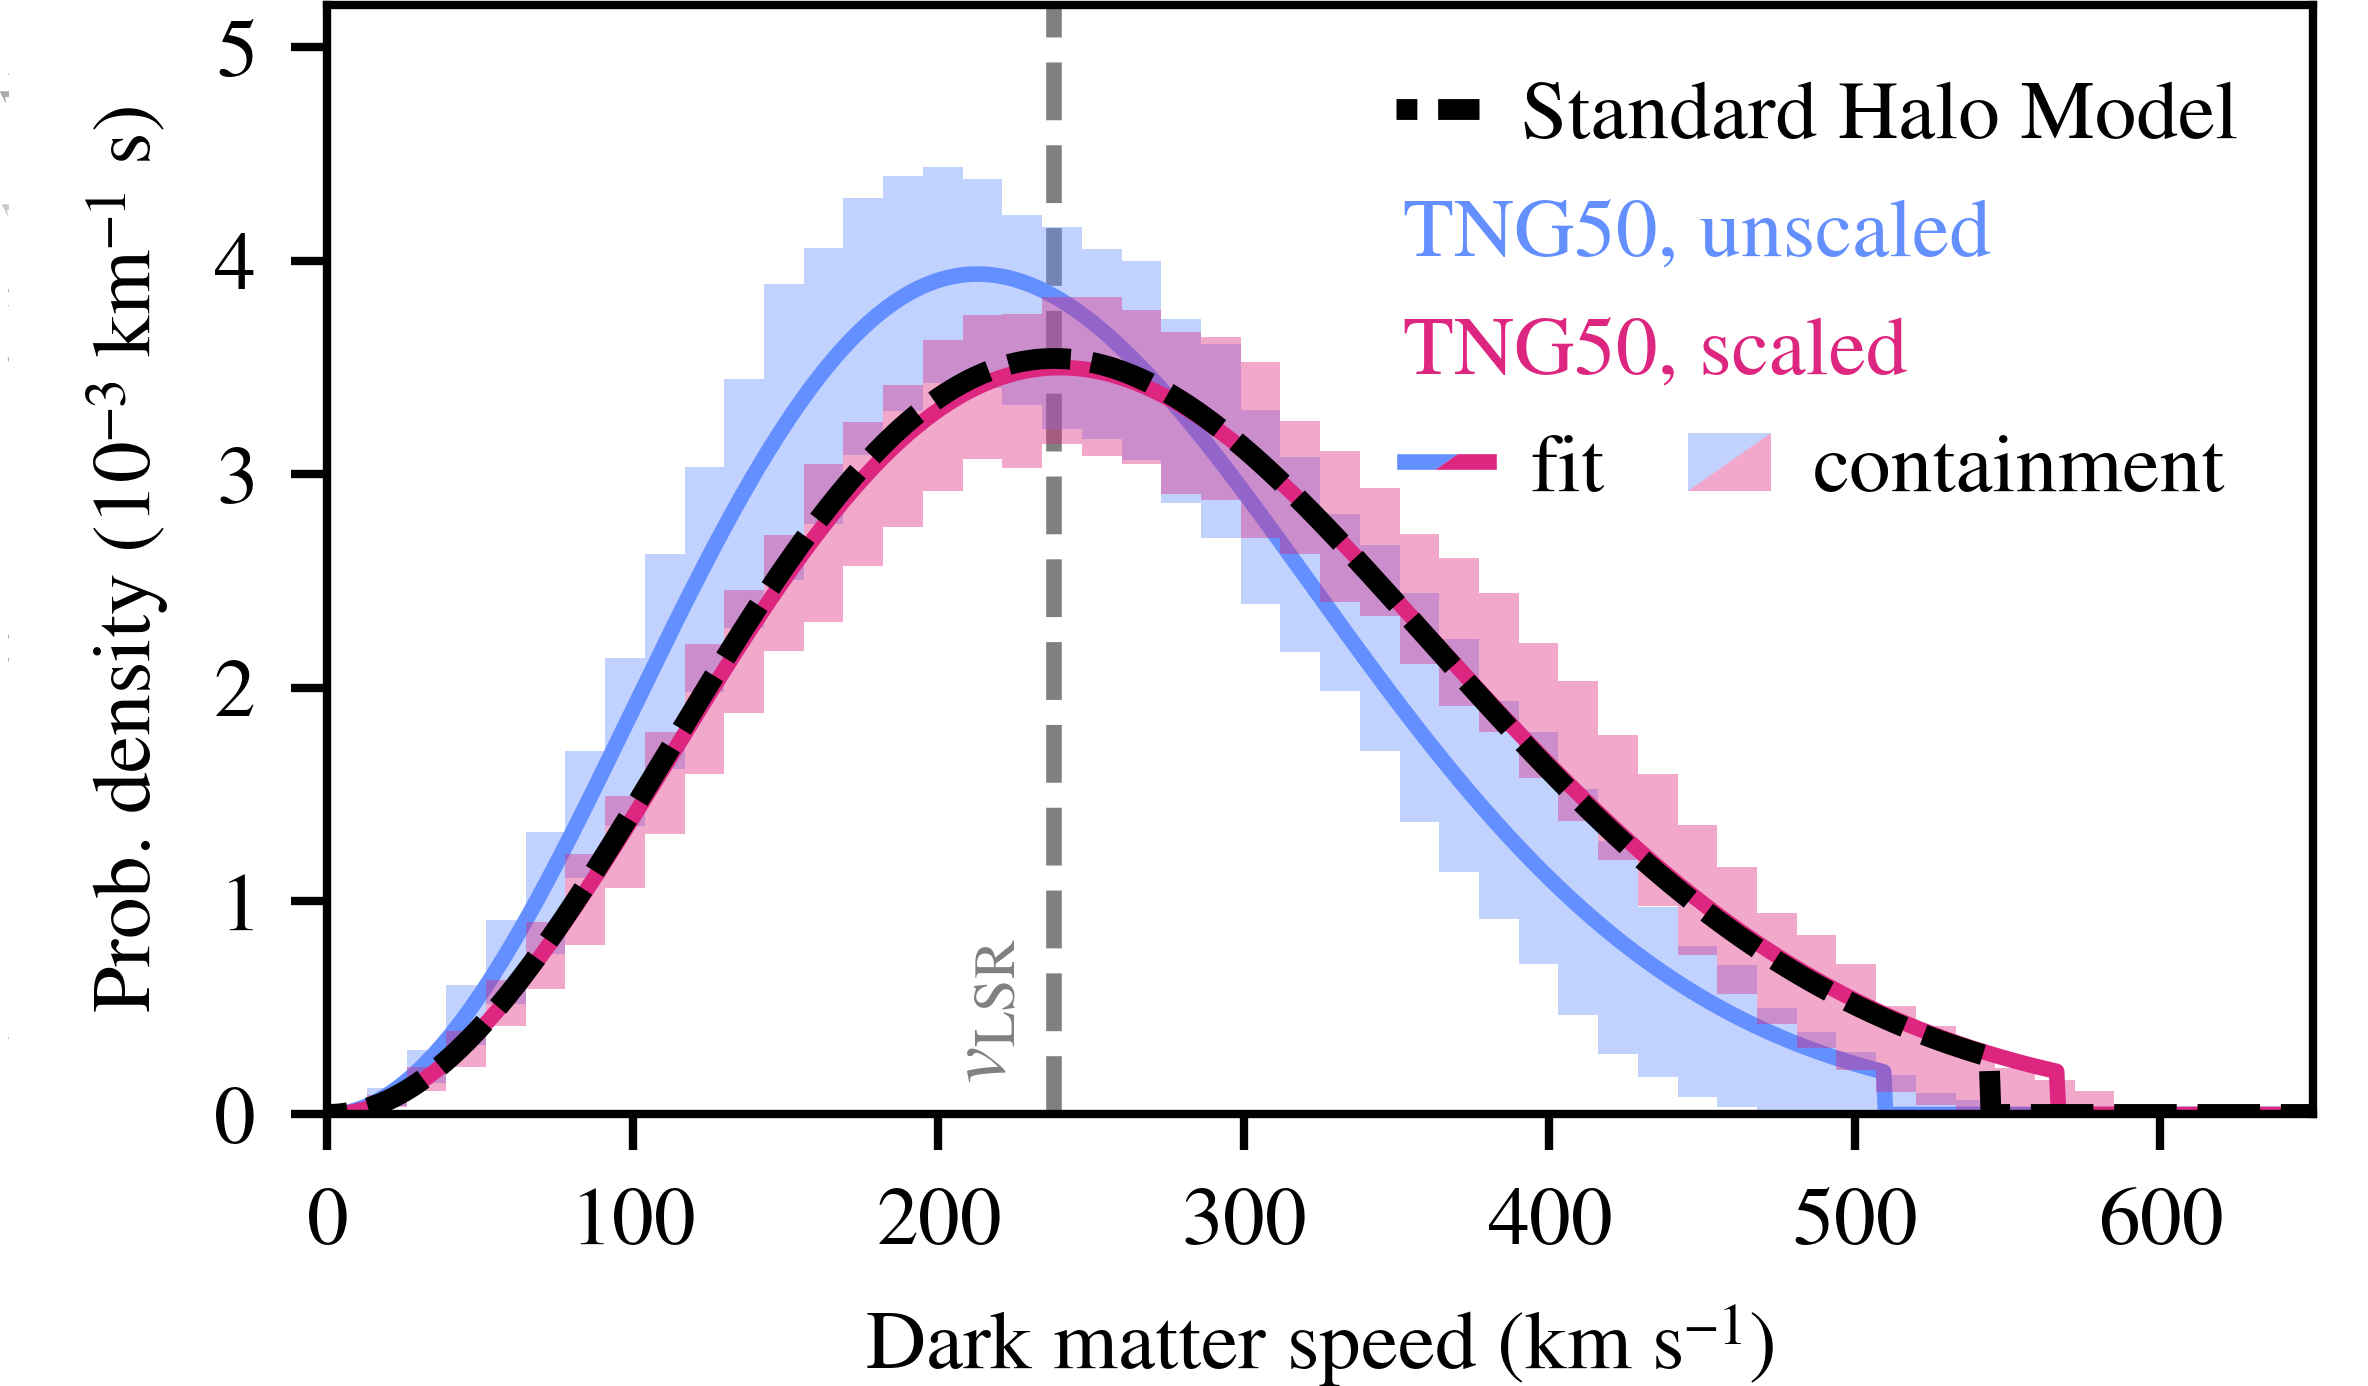
The sensitivity of direct detection experiments depends on the phase-space distribution of dark matter near the Sun, which can be modeled theoretically using cosmological hydrodynamical simulations of Milky Way–like galaxies. However, capturing the halo-to-halo variation in the local dark matter speeds—a necessary step for quantifying the astrophysical uncertainties that feed into experimental results—requires a sufficiently large sample of simulated galaxies, which has been a challenge. In this Letter, we quantify this variation with nearly 100 Milky Way–like galaxies from the TNG50 simulation, the largest sample to date at this resolution. Moreover, we introduce a novel phase-space scaling procedure that endows every system with a reference frame that accurately reproduces the local standard-of-rest speed of our Galaxy, providing a principled way of extrapolating the simulation results to real-world data. The ensemble of predicted speed distributions is well characterized by the standard halo model, a Maxwell–Boltzmann distribution truncated at the escape speed, though the individual distributions can deviate from it, especially at high speeds. The dark matter–nucleon cross section limits placed by these speed distributions vary by ∼60% about the median. This places the 1σ astrophysical uncertainty at or below the level of the systematic uncertainty of current ton-scale detectors, even down to the energy threshold. The predicted uncertainty remains unchanged when subselecting on those TNG50 galaxies with merger histories similar to the Milky Way. Tabulated speed distributions, as well as Maxwell–Boltzmann fits, are provided for use in computing direct detection bounds or projecting sensitivities.